Siwenoid v2 map: Difference between revisions
No edit summary |
No edit summary |
||
| Line 1: | Line 1: | ||
{{Languages|Siwenoid_v2_map}} | {{Languages|Siwenoid_v2_map}} | ||
__TOC__ | |||
= Using Maps = | = Using Maps = | ||
== | == The parts of the screen == | ||
[[Image:Preference_map_overview.jpeg|left|thumb|800px]] | [[Image:Preference_map_overview.jpeg|left|thumb|800px]] | ||
| Line 51: | Line 51: | ||
'''19) Shape: ''' You are able to create shape drawings on the map, for example circle. | '''19) Shape: ''' You are able to create shape drawings on the map, for example circle. | ||
== | == Navigation on maps == | ||
'''1) Zoom: ''' We can zoom in or out from the map with the mouse wheel. The center of the zoom will be at the mouse cursor. | '''1) Zoom: ''' We can zoom in or out from the map with the mouse wheel. The center of the zoom will be at the mouse cursor. | ||
Revision as of 12:53, 10 September 2018
| Language: | English • magyar |
|---|
Using Maps
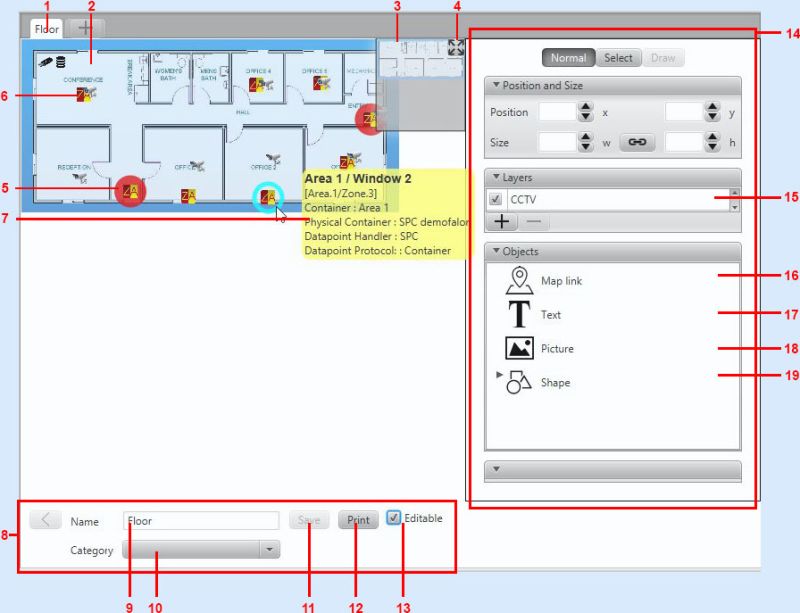
The parts of the screen

1) Maps name: The name of the opened map
2) The map: The saved map-image. We can zoom in and out and drag the map by the mouse cursor and wheel
3) Minimap: If we use a big map what cannot be shown at once, or we zoomed into the map the minimap shows us where we are on the bigger map.
- We can use the minimap for navigation by clicking on its window.
4) Reset button: By pressing hte button the top left corner of the map will set to the place 0x0 and the zoom of the map is set to 100%. This is the initial view of the maps.
5) Datapoint (under alarm status): Datapoints by types are represented as icons on the maps.
- If the status of the datapoint differs from "Normal" then the icon of the datapoint is highlighted by the color of the event category of the status.
- If the status is not yet acknowledged the icon is blinking.(In the example we can see an intrusion zone under alarm status.)
6) "Normal" state datapoint: Datapoints with "Normal" status are not highlighted with any color.
7) Settings options: (With the appropiate permissions) We can set the name and category of the map. Dont forget to click "save" after we make changes to the map
8) Map manage: Map manage options can be found here.
9) Maps name: You can set or change the maps name here Save is neccesary!
10) Map group: Map groups can be selected from here.
11) Save button: Everything what was changed can be saved with this button.
12) Print button: You can print the map with this button.
13) Editable checkbox: If the checkbox is checked you can edit the map.
14) Map editor: Map editor tools can be found here.
15) Layers: Datapoints can be divided into layers. If the layer is activated the datapoints on the layer are visible, else it's not.
16) Popup map: You are able to assign maps to icons, and set those icons to creat popup maps.
17) Text: You are able to create texts on the map.
18) Set picture on map: You are able to set pictures on the map
19) Shape: You are able to create shape drawings on the map, for example circle.
1) Zoom: We can zoom in or out from the map with the mouse wheel. The center of the zoom will be at the mouse cursor.
2) Panning the map: You can pan the map by the mouse with click-and-drag.
If the map cannot be viewed, We can reset the map view with the button (4) if we panned / zoomed the map away from the screen.