Siwenoid v2 Operation manual
| Language: | English • magyar |
|---|
The main screen
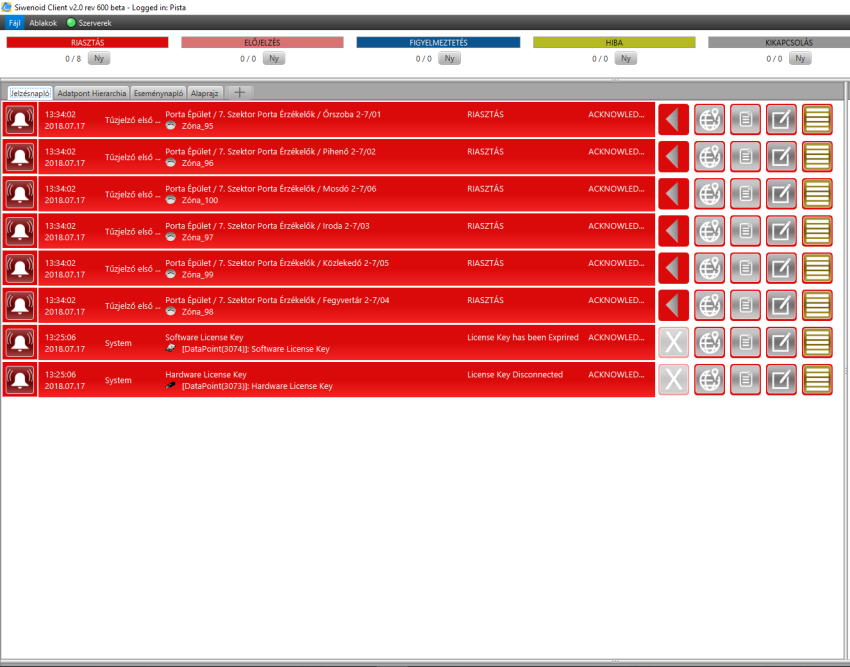
The Main Screen is the software's most important screen. Incoming signals with different statuses are shown here in the Signal log.
Every event is separated by category color and icon. It's possible to open map, send command, write a comment or open the Datapoint hierarchy at the end of the signal line.
Menu bar
Up in the title bar you can see the name of the software, version, and the user who is logged in.
Right under that you can find the menu bar. In the menu bar you can find file and window tabs. Next to them there is a small server indicator which shows the server status. Green indicator means the server is communicating, red means it is not.
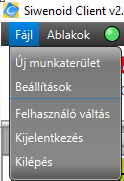
Under File you can see the following options:
   • New worksapce
   • Settings
   • Change user
   • Log out
   • Exit

Under Windows you can save the position of the opened windows, or close all of them by one click.
Category bar
Under the menu bar you can see the category bar.
Every category has a name, color, and priority. Priority order from left to the right.
By clicking on a category, you can filter the signal log. Alarm has the biggest priority of all so it is not filterable!(by default, priority order can be changed, so is the filter options) under the category you can find a counter which shows the events in that specific category. unacknowledged/all event in that category.
Next to the counter there is a „ACK”(acknowledge) button. You can acknowledge every event in that category with only one click.

Signal log
The signal log is the main information source during the daily operation. Every event gets in here. For an example, alarm event will be highlighted in red (the category's color) and plays the alarm sound (cateogry's sound) when it appears in the signal log.
A blinking new event can be acknowledged by clicking on it. In the event line first you can see the event's date and time.
Next in line you can see the event's logical place, then the datapoint's name.
After the datapoint's technical text you can see the event's status, it shows what happaned to the datapoint. Alarm for example.
Finally you can see if the event is new or acknowledged. Attention: if an event is acknowledged it means only that the event is seen and acknowledged by a user.
If the event is not acknowledged, but the signal had ended, then the line's background changed to black and gets a deleted text.

After each line there are 5 buttons, from left to the right they are:
1; Send default command. The most possible logical command to the signaling datapoint. If we draw our mouse over the default command's icon, the tool-tip tells us what the default command is. The button's image is related to the command's type. Right click to the default command button, and all the possible command appears which is possible to send to the signaling datapoint.
2; Show map. It shows the signaling datapoint's map.If we press the button, the map appears and highlights the signaling datapoint. Notice that if there are no map attached to the datapoint, the button is transparent, and not active.
3; Show intervention text. It shows the attached intervention text to the datapoint. Notice that if there are no text attached to the datapoint, the button is transparent, and not active.
4; Add comment. By pressing this button we can add or see previous comments to the datapoint.
5; Show in the Datapoint Hierarchy. It highlights the signaling datapoint in the Datapoint Hierarchy.
There is a chance in order to acknowledge the event, the user must do various tasks. Like choose an option from the possible options, etc.
Datapoint Hierarchy
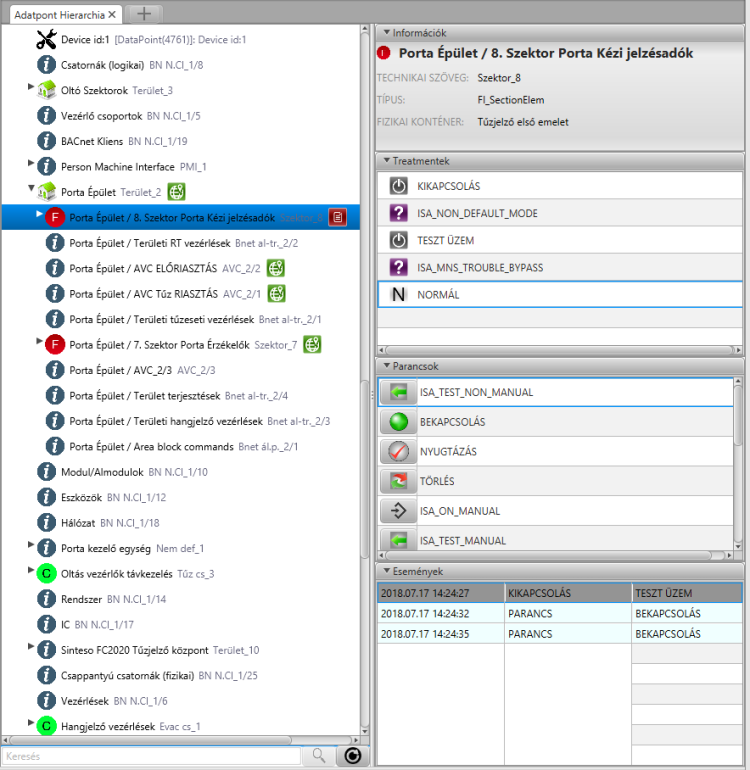
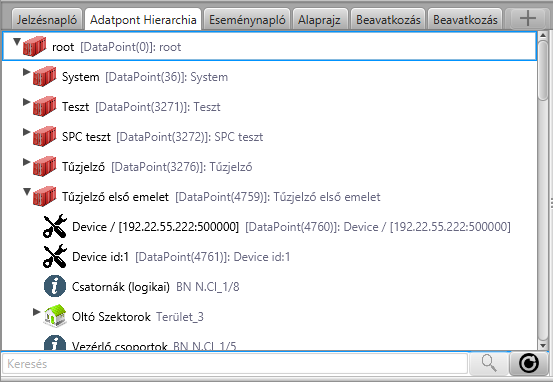
In this window you can see the datapoints in a certain hierarchy. You are able to open some of the datapoints down with the arrow next to it to see it's child, or you can double click on the line in order to do that.
The selected items are highlighted with blue background.
Items with red container icons are logical containers, these containers are for organizing the datapoints in the user's logical way.
Datapoints with sensor icons are usually sensors, but they can be zones or controls too.
On the right side of each lines, icons shows if a map or intervention text is assigned to the datapoint.
On the right part of the screen, there is the informational panel with the name and technical text.
If the datapoint has a map or technical text, you can see it from here too.
Under the information panel you can see the treatment table with the possible statuses, under that you can find the command list, and finally there is a special event log which shows everything about the selected datapoint in the last 24 hours.
The treatment table is highlighted with the actual status of datapoint.
If the new event is not acknowledged you can acknowledge it here by clicking on the line.
If a datapoint is selected, at the information box there is a little map icon, note that the icon appears only if a map is assigned to the datapoint. Click on the map icon in order to open the map.
Under Commands, you can find the possible commands of the datapoint.
You can use the command's icon to send the selected command directly.
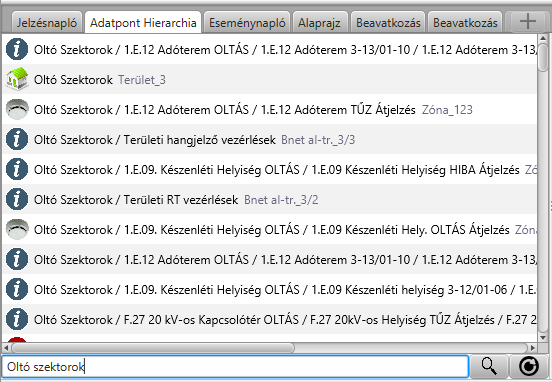
At the lower left side of the screen there is a search bar, it is possible to search between the datapoints by name or technical text. After the search field is filled, hit ENTER, or click on the search icon.
Next to the search icon there is a reset button, which sets the datapoint hierarchy view to default.
Event log
Event log contains every event and every other software record too.
With the help of the Event log we can track everything, a server disconnection or unauthorized login for example.
The event memory stores the events on the datapoints, commands, names, texts, acknowledgements.
Each event has 4 columns, first contains the time and date, second the category or type.
The third contains the name, and in case if a comment was added then the comment too.
The fourth contains in case of signaling the name of the status, or in case if it was a command then the name of the command. Moreover if the event had a comment, then the user's name who made it appears here.
The Event list is organized by time, and refreshes automatically.
We can filter the log with the search fields under. We can search for phrases, date and time, names, event, category etc.
We can use the calendar icons to choose the date.
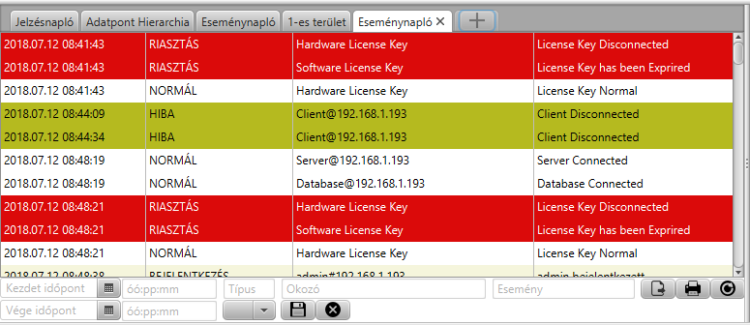
Under the Category field, we can choose from saved search templates from the drop-down menu.
The Refresh button resets every search filter. You can find the reset button on the right side of the screen next to the Printer button.
With the Printer button we can print the log if it is filtered, this is necessary in case of a big system with millions of log lines.
We can export the filtered Event log with the left button next to the printer. Possible formats are: CSV, HTML or XLSX.
The system automatically archives the log after a certain amount of data.
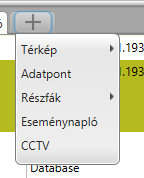
+ Tab
Under Map tab we can open additional maps. More information about maps in the next phase.
By clicking on Datapoint we can open an additional Datapoint hierarchy.
Under Subtrees we can find the existing subtrees.
With the Eventlog we can open an additional Event log.
Map
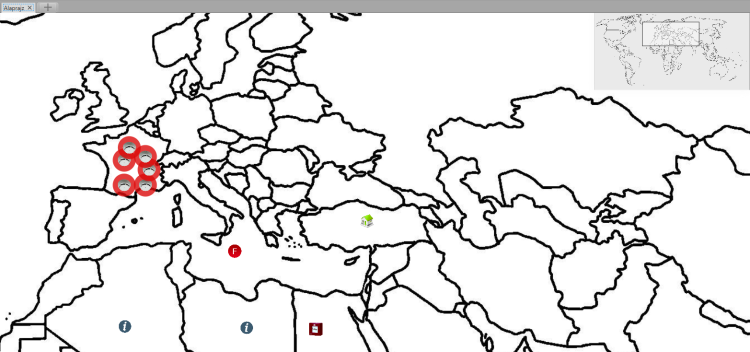
Maps are usually floor maps of buildings and places, and they are equipped with sensors and popup map buttons.
Sensors appears as buttons on the map, if the mouse pointer is on the datapoint's icon, a tool-tip appears and shows information about the datapoint.
Right click on the Sensor button and the menu shows up. It is possible to send commands from here, under the command menu.
If the Datapoint on the map has an active status, then the datapoint on the map is highlighted with the event's category color. Alarm event example shows on the picture.
If the event is not yet acknowledged, then the button is blinking.
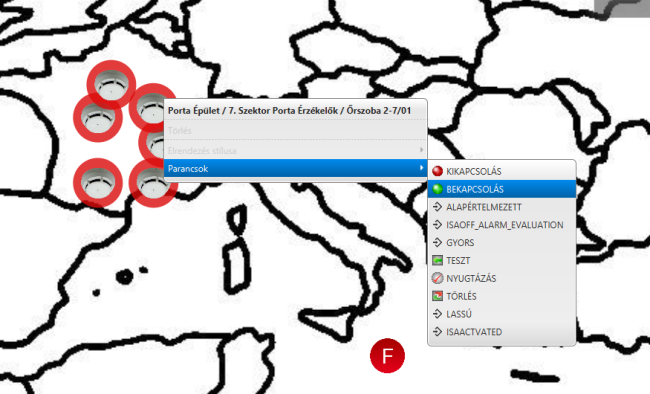
The map is zoom able, use the mouse wheel to zoom in and out. Use left mouse button to drag and move on the map.
Upper right corner there is a mini-map which shows the actual position of the user.
Under the mini-map there is the zoom reset button, by click on it the map gets to the default position.

At the bottom of the Map screen, we can see the opened map's name, the Print button and the Editable checkbox. In order to edit the map user permission is required.
Next to the category we can find the the Map group's name, and the arrow next to Name is a step back button from the popup Maps, in case if there are popup maps on the Map.
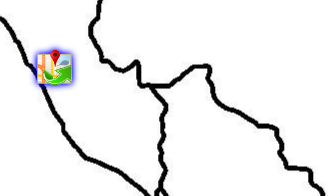
Az ugrótérképek, a térképen elhelyezett térképikonok aminek a megnyomásával nyitható meg az ikonhoz rendelt térkép.
Popup maps are the small map icons. If we click on it, the assigned map opens.
Intervention texts

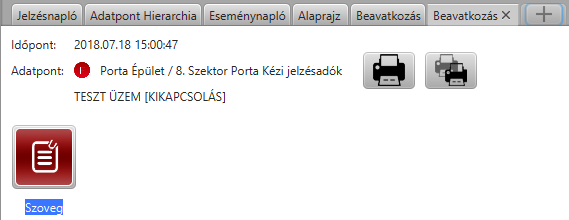
The Intervention text is the third button of the five in the event line, if the datapoint which caused the signal has an intervention text assigned to it.
The button is red if it has a text assigned to it, if not it is grey.
By clicking on the button we can open the text. The text is printable. (The Intervention text can be opened automatically if the automatic text opening is set in the Task settings.)
