Create map
| Language: | English • magyar |
|---|
Previous chapter-> Datapoint treatment / Next chapter-> SNMP configuration
Datapoints can be shown on maps as dynamic icons. A map always contain a background image and several foreground dynamic symbols.
Create a map
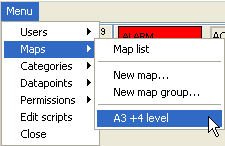
Use Menu->Maps->New map... to create a new map. An empty map opens.
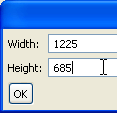
Before you should use a picture as a map select Map_menu->Set_size... to tell the system the size of the picture (by pixels). It should correspond to the background image's dimensions. If you forget to do so the background picture will be streched to resize the map to the set size.
After pre-setting the size of the the image select Map_menu->Set_picture... to upload the image as a map. Use file selection dialog to select the background map from the computer. Several image formats are supported (like bmp, jpg, png, gif). Image files are always uploaded to \server\data\maps\ folder even if they were selected from a client.
Then application takes care of the synchronization of the content of \server\data\maps\ and \client\data\maps\. This is hidden from the user and commissioner. This technic also ensures that the map images are not copied back and forth from server to client. The synchronized copies are stored in a local client folder.
_

Set the name of the map at the bottom of the map window. Here you can assign the current map to a group. Map groups can be defined in Menu->Maps->New_map_group...
Always save the map using Map_Menu->Save.... An asterix indicates in the caption if a map has been modified but still not have been saved.
Add a dynamic icon to a map
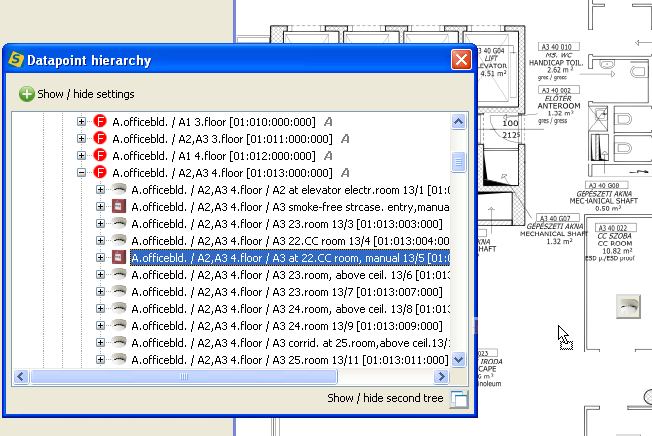
Open the tree and drag&drop any datapoint onto the map. Datapoint will appear with its default icon. Its position can be changed later by drag&move&drop it. Using popup menu it is possible to change the default icon of a datapoint. If you want to change multiple datapoint together use Setting menu of map window.
Default map assignment
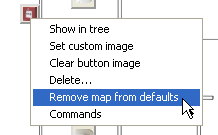
Datapoint can have several instance on the same map and they can be placed on more than one map. In this case it is necessary to define which map should open when user click on the map button of an event in EventViewer. Find the datapoint on the map, and right click on the icon. A popup menu opens. Here you can "Remove map from defaults" and "Add map to defaults". More than one map can be assigned as default to a datapoint. In this case each default map will open when you click on the map button of an event in EventViewer.
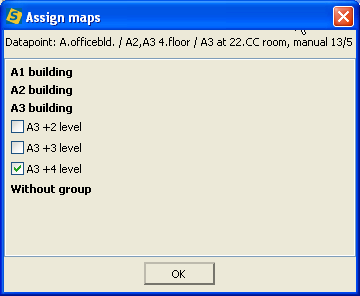
You also can assign a datapoint to a map what doesn't contain the datapoint itself. This is useful when you want a datapoint to assign to a map where its parent datapoint is assigned (but itself doesn't). Find the datapoint in the tree, and bring up the popup menu by right-clicking on it. Select "Edit map assignments...". A list appears with all maps. Checkboxes show if the map is set to be the default map to the selected dataopint. You can select as many maps as you want. Each map will open when you click on the map button of an event in EventViewer.
Add a link to another map
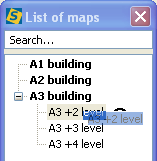
Open "List of maps" dialog by Menu->Maps->Map list. Here you can find all of the maps that are defined in your project. From this list select any map and drag&drop onto the map. A green icon appears. Click on it and the associated map opens. You can add as many map link icon to a map and a certain map link icon can reside on more than one map.
When you drop the map icon onto an existing datapoint icon then it aligns automatically on the left side of existing icon. With this feature a parent datapoint and its "children map" can be easily kept together.
Add a print icon to a map
Change the appearance of an icon
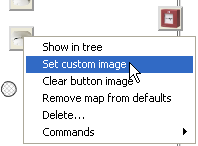
Right-click on an icon and on popup menu select Set custom image. In the file dialog select an image for the icon. It will be stretched to the size of icon.
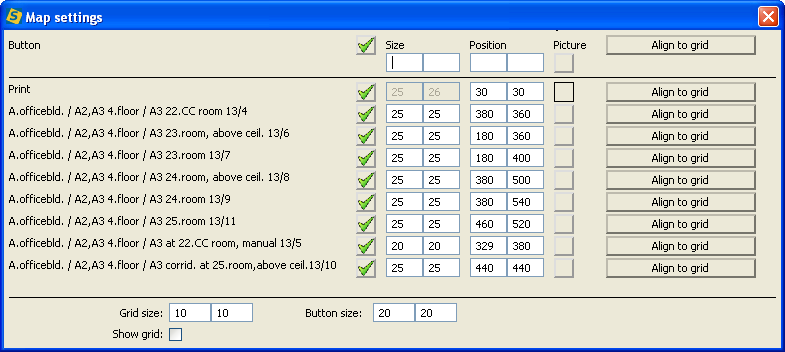
Open "Map settings" dialog by Settings menu of a map. This dialog lists the dynamic icons and elements of the map. In the corresponding fields the size and positions of elements can be changed. Use the check flags to make changes on multiple elements. In this case type the values on the most top separated input fields.
On the bottom set the default button size that will be used during the next drag & drop.
Use show grid checkbox to lay a grid onto the map. If you press ALT and drag and icon now, then during drop its top-left corner will be aligned to the closest grid.
Map layers
With the built-in drawing tool you can put drawing objects to layers. Drawing objects are: line, arrow, text. Layers can be switched on and off and thus the related drawing objects are visible or hidden.
Previous chapter-> Datapoint treatment / Next chapter-> SNMP configuration