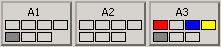
Event category buttons correspond to the existence of any non-normal event in its own category. Indicator lamp is blinking if any non-acknowledged event is in the event-queue. It is continuously on if only acknowledged events are in the category queue, and OFF (grey) if there is no any event in its category. Numbers indicate the non-acknowledged/acknowledged events in its own category. Collective acknowledge button allows acknowledging all events in its own category by a single action. Colors correspond to the categories and are reflected throughout the application.
Date/Time and user login
System date and time is synchronized with the server time (server time is gained from that PC on which it is running). It’s not possible to set this time in the application. It should be set through the server OS system date/time tool. Click on the "user" button for user-logout. In the user login window, fill in the new user name and password. User rights are assigned to the different users. User permissions can be set in the application permission menu (mainly by admin rights).
EventView
Click on the header of event category buttons, to filter the records of the queue by its categories. Header buttons ON-OFF state indicate if the corresponding category is shown or hidden in the EventView.
Using the „ON LINE” button, you can freeze temporary the incoming events in the EventView. This is useful when mass of events raise in a very same time and the incoming events make difficult to analyze or handle the most important pending events. EventView is unfreezed in 2 minutes automatically without any user interaction.
Use TIME/CAT buttons to sort the EventView. Choosing the „CAT” button the events are sorted by category. While choosing the „TIME” button events are sorted by the time-stamp (when event occurred in the system). In case of a subsystem that uses timestamps in its communication protocol, this time comes from the subsystem (real-time occurrence). Some subsystem doesn’t use timestamp in its protocol. In this case the management system assigns the time information to the events when it was captured.
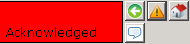
At the left side of a record the blinking or continuous status of button indicate the non-acknowledged/acknowledged status of an event. Click on this button to open the intervention text window of the associated datapoint.
At the right side of an event record 3 buttons reside. Click on the first button to send the default command to the datapoint. Click on the second to open the Treatment window. Click on the third to open the associated map. Click on the comment button to assign a comment to the event. Drag&drop the comment to other record too.
Treatment table
Treatment table lists the possible status of a certain datapoint (control unit, area, section, zone,...), and lists the commands that can be sent to a certain datapoint. Lamps indicate the active status and category. Datapoints are multi-state. Blinking or ON lamp correspond to the acknowledged and non-acknowledged status. Click on the lamp to acknowledge the corresponding event on behalf of management system. This action doesn’t send acknowledge command to the subsystem, it simply stops blinking the lamp and register in history that operator got notification on the event. To acknowledge the subsystem itself you have to click on the appropriate command button . In most case datapoint status will be changed after sending a command to subsystem. (ACK-ALARM, EXCLUDE, NORMAL...).
Click on button to open the map that is primary associated with the datapoint. Click on button to open the ListView that is associated with the datapoint. Click on to open the tree. Datapoint will be highlighted for 3 second in the tree.
Treatment Table call possibilities:
Click on the second button at the end of a certain event in the EventView
Click on the button on List View, if the datapoint description has a green background (it has no child datapoint).
Click on the dynamic symbol of a certain datapoint on the map .
List View
A ListView is a tool to navigate in the datapoint hierarchy (areas, sections, zones...) in text mode. Their colors and lamps indicate the status of certain datapoints. Possible way to call ListView:
Click on any dedicated-container to open the associated ListView.
On the TreatmentTable click on the button to open the associated ListView.
On the maps click on the button. Now this datapoint-list contains brother nodes of the original one that are normally on the same map.
Click on the button of upmost grey line to open the parent ListView.
Click on any text button to open the associated map.
If a text button is grey then click on its button to go down in the hierarchy and to open its child ListView.
If a text button is green then click on its button to open its Treatment Table.
Color of a buttons , , and blinking or ON status indicates the status of the corresponding datapoint, or the highest priority status of its children nodes (propagated status).
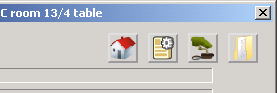
Bottom menu
Bottom menu contains the following buttons:
Event log opens the history.
Tree opens the datapoint hierarchy.
Search opens the search window which allows to find a datapoint by its minimum 3 letters.
Note allows you to add a record to the end of Event log (History).
Close windows closes all floating windows.
Maps
Different methods to open a map:
Click on button to open the map that is primary associated with the datapoint.
Click on button to open the map that is primary associated with the datapoint.


 button on List View, if the datapoint description has a green background
  (it has no child datapoint).
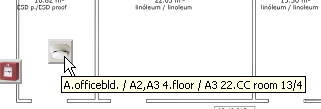 .
.
 to open the associated ListView.
 button to open the associated ListView.
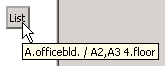 button. Now this datapoint-list contains brother nodes of the original one that are normally on the same map.

 button to open the map that is primary associated with the datapoint.