Everyday operation of Siwenoid
| Language: | English |
|---|
Everyday operation of Siwenoid
After starting the software we can see the default screen of Siwenoid (→ The starting screen of Siwenoid)
On everyday operation this screen is what we use most frequently.
1) The event categories bar
On the top of the screen we can see all categories in which every signal from the subsystems are arranged into. The colors of the categories are matched to the colors of the Signal log.
- The bar of the event categories are not part of the Signal log but it makes the use of it easier.
- The event categories are always visible and cannot be hidden no mater what window arangement we use.
- Straight forward colors: On the maps, in the event and signal log we see the colors of the event categories. So we can know that every text with red background is about alarms.

- 1; Event categories
- All signals, events, alerts from the subsystems are arranged into these categories.
-> "NORMAL" status is not shown in the bar of event categories since it is never shown in the signal log.
- Normal status is everything when the datapoint is operational and capable of communicating, like an activated smoke detector, an armed intrusion zone etc.
- 2; Hidden event category
-We can hide signals from a specific category by clicking on its name. On this case every signal from the selected category are hidden from the signal log.
-> The background of the hidden categories are transparent.
-> We cannot hide the "ALARM" category.
-When servicing a fire alarm unit many detectors can be "Excluded". This can interfere the visibility of the signal log.
- 3; Bulk acknowledge button
-By clicking on this button every new event in this category is "acknowledged" in the software.
->The button doesn't send commands to the subsystems but only registers in the software that the events were noticed by the user.
-Many detectors of one connected system can signal simultaneously, for example all detectors of a deactivated zone. In the software these can be acknowledged by one click.
- 4; Acknowledged / Not acknowledged events
-Indicating number that shows how many events we have in the category and how many of them are acknowledged.
-The "1/1" in the example are showing us that we have one event which already have been acknowledged in the software.
2) Parts, details and usage of the Signal log
The signal log is the main indication unit of the software where the alerts and disorders are shown from the subsystems.
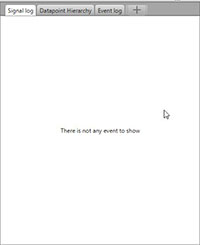
- We rarely can see an empty signal log (shown on he picture) since a bigger site always have some disabled detectors for example.

Parts of the signal log
The signal log shows every signal coming from the integrated datapoints. All indications are color coded with the represented event's color as in the event categories. This is the primary indication interface for the users.
- Alarms (red background by default) are always shown on top of the screen so they never get lost among the list of disabled sensors.
- If the category of the event is hidden then the signals from that category aren't shown in the signal log (but they can be acknowledged from the event category buttons).

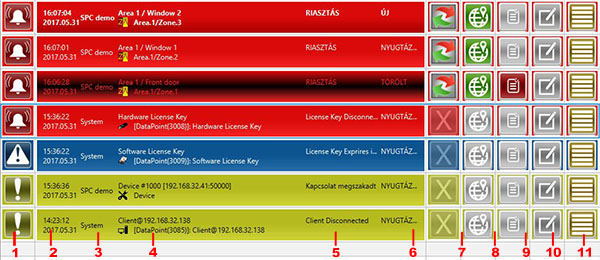
1; Icon of the category: The default icon of the category of the event.
2; Timestamp: The time of receiving the event.
3; Physical container: From which physical container is the signal coming from.
4; Datapoint's name: The name of the signaling datapoint
5; Description of the error: The caouse of signaling (In the example the licenced client application is not connected to the server, so the status is "CLIENT DISCONNECTED".)
6; Status of the signal: The fresh, not yet acknowledged signals backgound is blinking.
The status of hte signal can be:
- New event (blinking line)
- Acknowledged event (not blinking line)
- Deleted event (black background, inverted text color)
Buttons:
7; Default command: The command we most likely want to send to the system in case of this signal.
- If by the event's type it's not clear what command should be sent then the button is disabled. Even though by right-clicking on the disabled button we can see the list of possible commands what we can send to the datapoint.
- The default command is predefined in the software based on the integrated subsystem and the type of the datapoint.
8; Show on map: If the signaling datapoint is placed on a map (green backgound on hte button shows that) we can open the corresponding map and see the datapoint by pressing the button. Tha datapoint's backgound blinks for a few times with the color of the signaling event's category.
9; Intervention text: Every datapoint can be assigned with an Intervention text what pops up every time the datapoint is signaling an event. This helps the end-users to help in the typical methods of solving events.(For example "The zone can't be re-set while the windows are open."
)
10; Write a comment: We can write comments to the events if it is necessary to document the events.(For example "Cause of disabling: maintenance".)
11; Show in tree: If we click on this button the datapoint will be selected in the datapoint hierarchy tree.
3) Deleted events: events with black background
The signals with black background can be acknowledged / hide from the signal log by one click. These are statuses what are not present by the time of viewing it in the software. So the users won't miss any events even if they had been acknowledged on a secondary client, or on the connected unit.

When can we see signals with inverted background?
- For example we don't have to send command to the fire alarm unit if the event were acknowledged on the unit itself.
- If someone on a different Siwenoid client is acknowledged the signal. (And acknowledgement by clients is setupped in Siwenoid)
4) Detecting and handling alarms from central units and datapoints
As we seen before all events from the datapoints are shown in thesignal log.
We can see a fresh alarm on the picture. The backgound of new events are blinking (and making sound signal based on settings) in the signal log.

Acknowledging alarms and signals!
The backgound of new events are blinking and the events making sound signal (based on settings).
Click on the event in the signal log!
The event is acknowledged in the software and the blinking terminates.
- If we use the bulk acknowledge button oin the event category line we can acknowledge multiple events by categories (→ The event categories)
- By this time no command is sent to the alarming central unit / sibsystem.
Resolve the alarm / signal
Check and resolve the event based on your job description.
Other possibilities before resetting an alarm
Before we send a reset (or other) command to the subsystem, we can:
- Show the alarm on a map.
- Write a comment to the event.
- We can check the intervention text assigned to the datapoint.
Sending a command to the subsystem
After we acknowledged the alarm, wrote comment to it etc. we can reset the subsystem.
- By pressing the (1) button we can send the most possibly needed command to the subsystem. This "default" command is based on the datapoin's type.
- Right clicking on the mouse we can see all possible commands what can be sent to the datapoint.
Showing the intervention text
The software can be set to show intervention texts automatically (if there are texts assigned to the datapoint) on specific kinds of events (like alarms, disorders etc.) If no automatical displaying setupped we can show the intervention text by clicking on button (3).
- The button is not clickable and its background is grey If there are no intervention text assigned to the datapoint.
Writing comment to the event
By pressing the button (4) we can write a comment to the selected event. This can be useful when reconstructing an event. Any user (with the right permissions) can write any number of comments to a single event.