The starting screen of Siwenoid v2
| Language: | English • magyar |
|---|
After we logged in...
After we logged in we can see the default screen and user interface of Siwenoid, with the signal log in front. We will see our customised interface what we previously setupped (if we did).
- Due to the constant development the design and usage of the software can be slightly change.
- The user manual can contain screenshots from different software versions so minimal differences can be observed between the manual and the used software.
Parts of the main screen
- Attention! In Siwenoid every displayed item and view is bound to permissions. A user with less permissions can see less options than we show here in the example.
- Although the signal log and especially the alarms cannot be hidden from any user.
Parts of the main Screen!

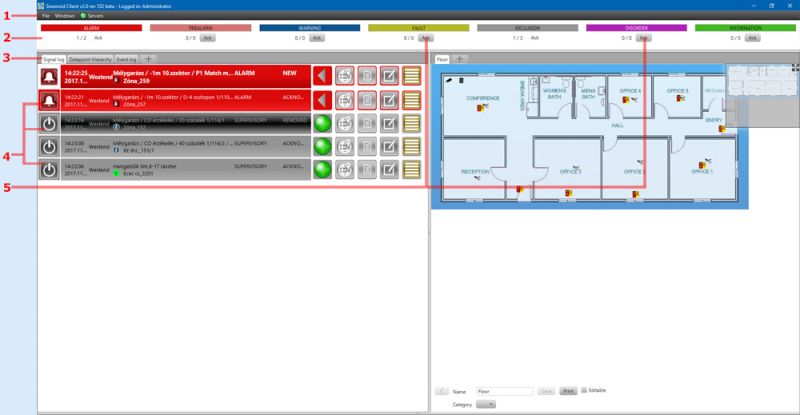
- 1; Main menu - The settings of the system can be accessed here.
- 2; Event categories - The signals and alerts from the connected subsystems all fall into one of these categories. (More in the chapter "Setting up")
- 3; Main windows - Under the main tabs we can find the signal log, the datapoint structure and the event log. We also can define our own tabs with maps (for example).
 Default tabs:
   ->Signal log - the alerts and other events are shown here.
   ->Datapoint hierarchy - here we can oversee the connected systems in a multi-level tree view
   ->Event log - the software logs every alert and action. We can check and search in the previous events here.
- 4; Parts of the signal log - The most important view of the software since all signals, events and alerts are shown here what the transmitters ("datapoints") of the connected subsystems are sending.
We can see every datapoint's status here where the status is different from "normal" (alarms, exclusions, line erros etc).
- 5; Bulk acknowledge buttons - With these we can acknowledge every alert in the corresponding category (This is ackknowledgement in the software only, no commands are sent to the security systems).
The workplaces of the main screen

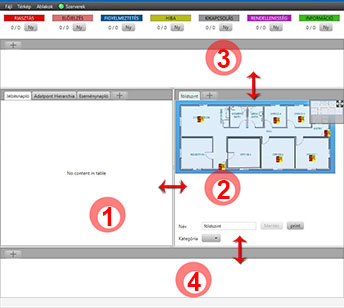
We can arrange 4 workspace on the main screen by dragging their side. On these workspaces we can arrange views of the application as we like.
Tabs what can be shown on the workplaces
Onto these 4 place we can open different application views with the "+" button on top.
These can be:
-Signal log
-Datapoint Hierarchy Screen
-Event log
-Any map
-Logical containers (Sub-trees of the datapoint hierarchy)
The intervention texts for events also opened on the workplace prevoiusly setupped for it.
Overview of the datapoint hierarchy screen
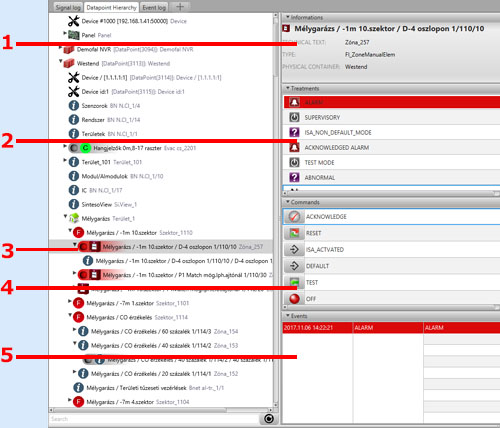
The Datapoint hierarchy screen shows the physical and logical containers of datapoints in a hierarchical tree view. All important details (→1,2,4,5) of the currently selected datapoint (→3) are shown.
The datapoint hierarchy screen have 5 different sections. The left side shows the logical and physical tree of the datapoints.
The right side of the panel if split into 4 sections.

- 1; Datapoint informations - The tecnical name (what is inherited from its physical container), the type and the name of the physical container of the datapoint is shown here.(These informations are necessery since the datapoints can be renamed in the software and can be moved to logical containers.)
- 2; Treatments (statuses) - The possible statuses of the selected datapoints can be seen here. The current status of the datapoint is highlighted (except "Normal").
- 3; Currently selected datapoint. - Shown in its place of the hierarchy.
- 4; Commands - The commands what can be send to the datapoint are shown here. You can send commands directly to the system by clicking on the command's icon.
- 5; Events - All events from the last 24 hours for the selected datapoint are shown here. (This is a filtered extract of the event log and only contain events for the one selected datapoint.)
The event log
Every incoming and outgoing events, signals and commands are logged in Siwenoid with one second accuracy. So every event can be traced back, can be filtered and can be exported.

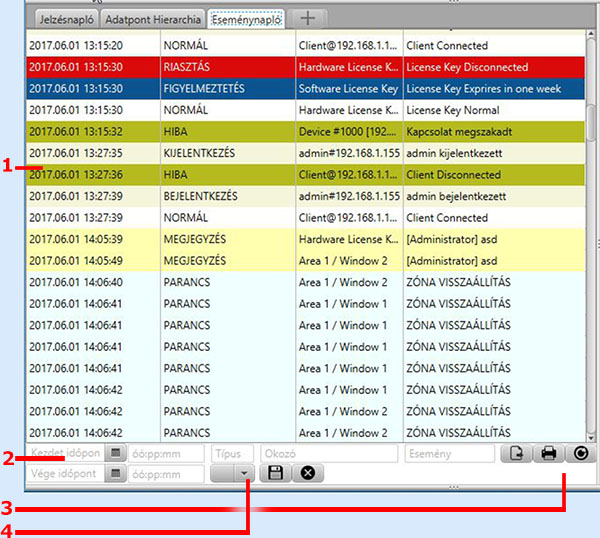
- 1; Every events are shown by the color of its event category. The time, status and the corresponding datapoint is shown.
- 2; Filtering options. We can search and filter the event log by date and time interval, plus we can search for phrases and names with the input fields under the columns.
- 3; Exporter buttons. The filtered event log of the Siwenoid software can be printed or exported in .XLSX, .CSV and interactive HTML format.
- 4; Frequent searches (like a specific door's signals or often alerting smoke detector) can be saved for quick access. These can be loaded instantly from the dropdown menu (fast search).